
Analytics Project
View LinkedIn Post
Real Estate Analytics Dashboard
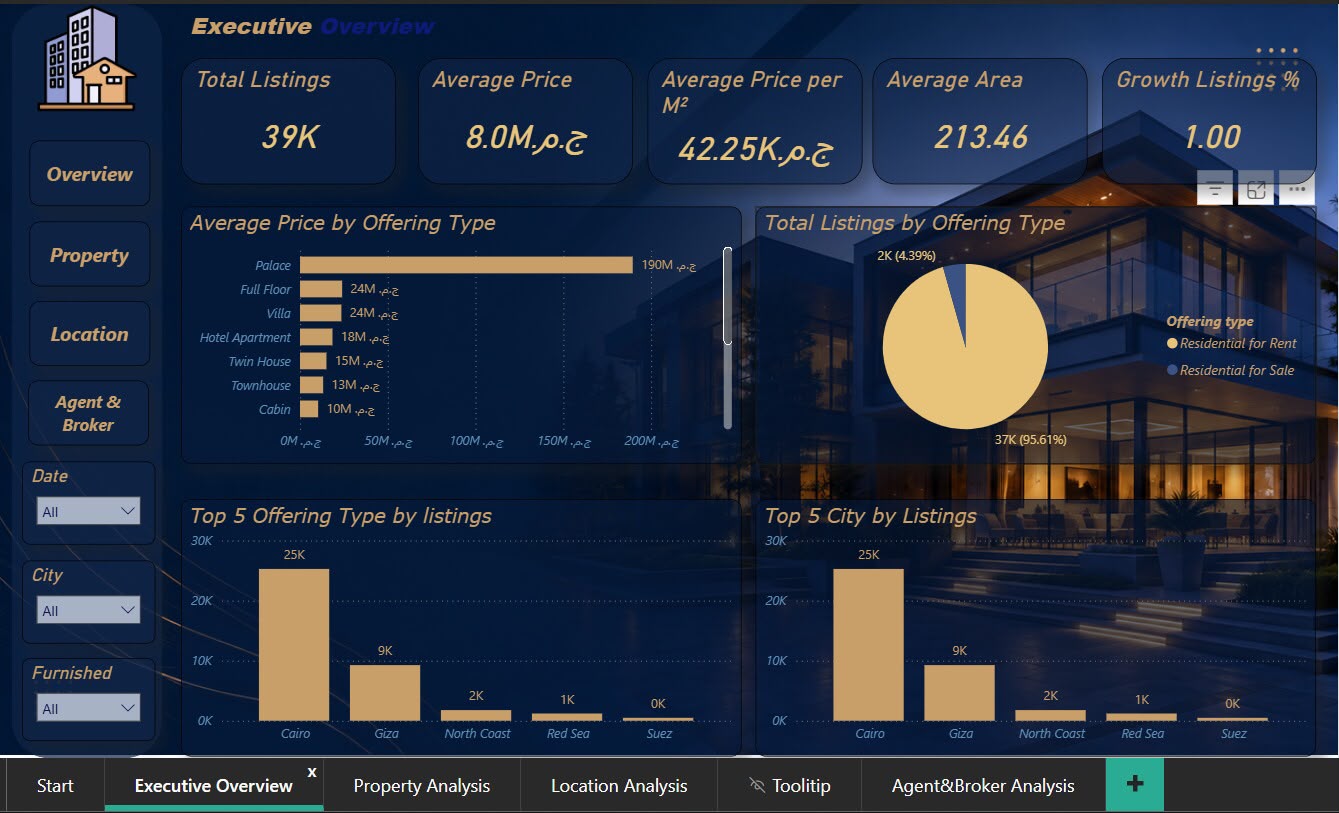
An interactive Power BI dashboard analyzing approximately 39K real estate listings across Egypt. It explores property prices, price per square meter, listing distribution, location trends, and agent performance to support data-driven decisions.
Power BIDAXData CleaningData ModelingData Visualization
Explore case study
Business question
How can real-estate listings across Egypt be explored to compare asking prices, price per square meter, geographic distribution, and agent activity?
Data & scope
Approximately 39,000 property listings, as described in the project post.
Workflow
- Prepare and clean listing data.
- Model the data and define measures in DAX.
- Build Power BI visuals for price, location, listing distribution, and agent performance.
- Use the dashboard to explore patterns and support follow-up questions.
What this demonstrates
Data preparation, metric design, modeling, and communicating a multi-dimensional dataset through an interactive report. Specific market conclusions should be taken from the dashboard itself; no unverified numerical findings are claimed here.